
The dashboard
Open a site from the list and you get Overview, optional feature tabs, and Settings. There is no Edit tab and no Embed Code tab.
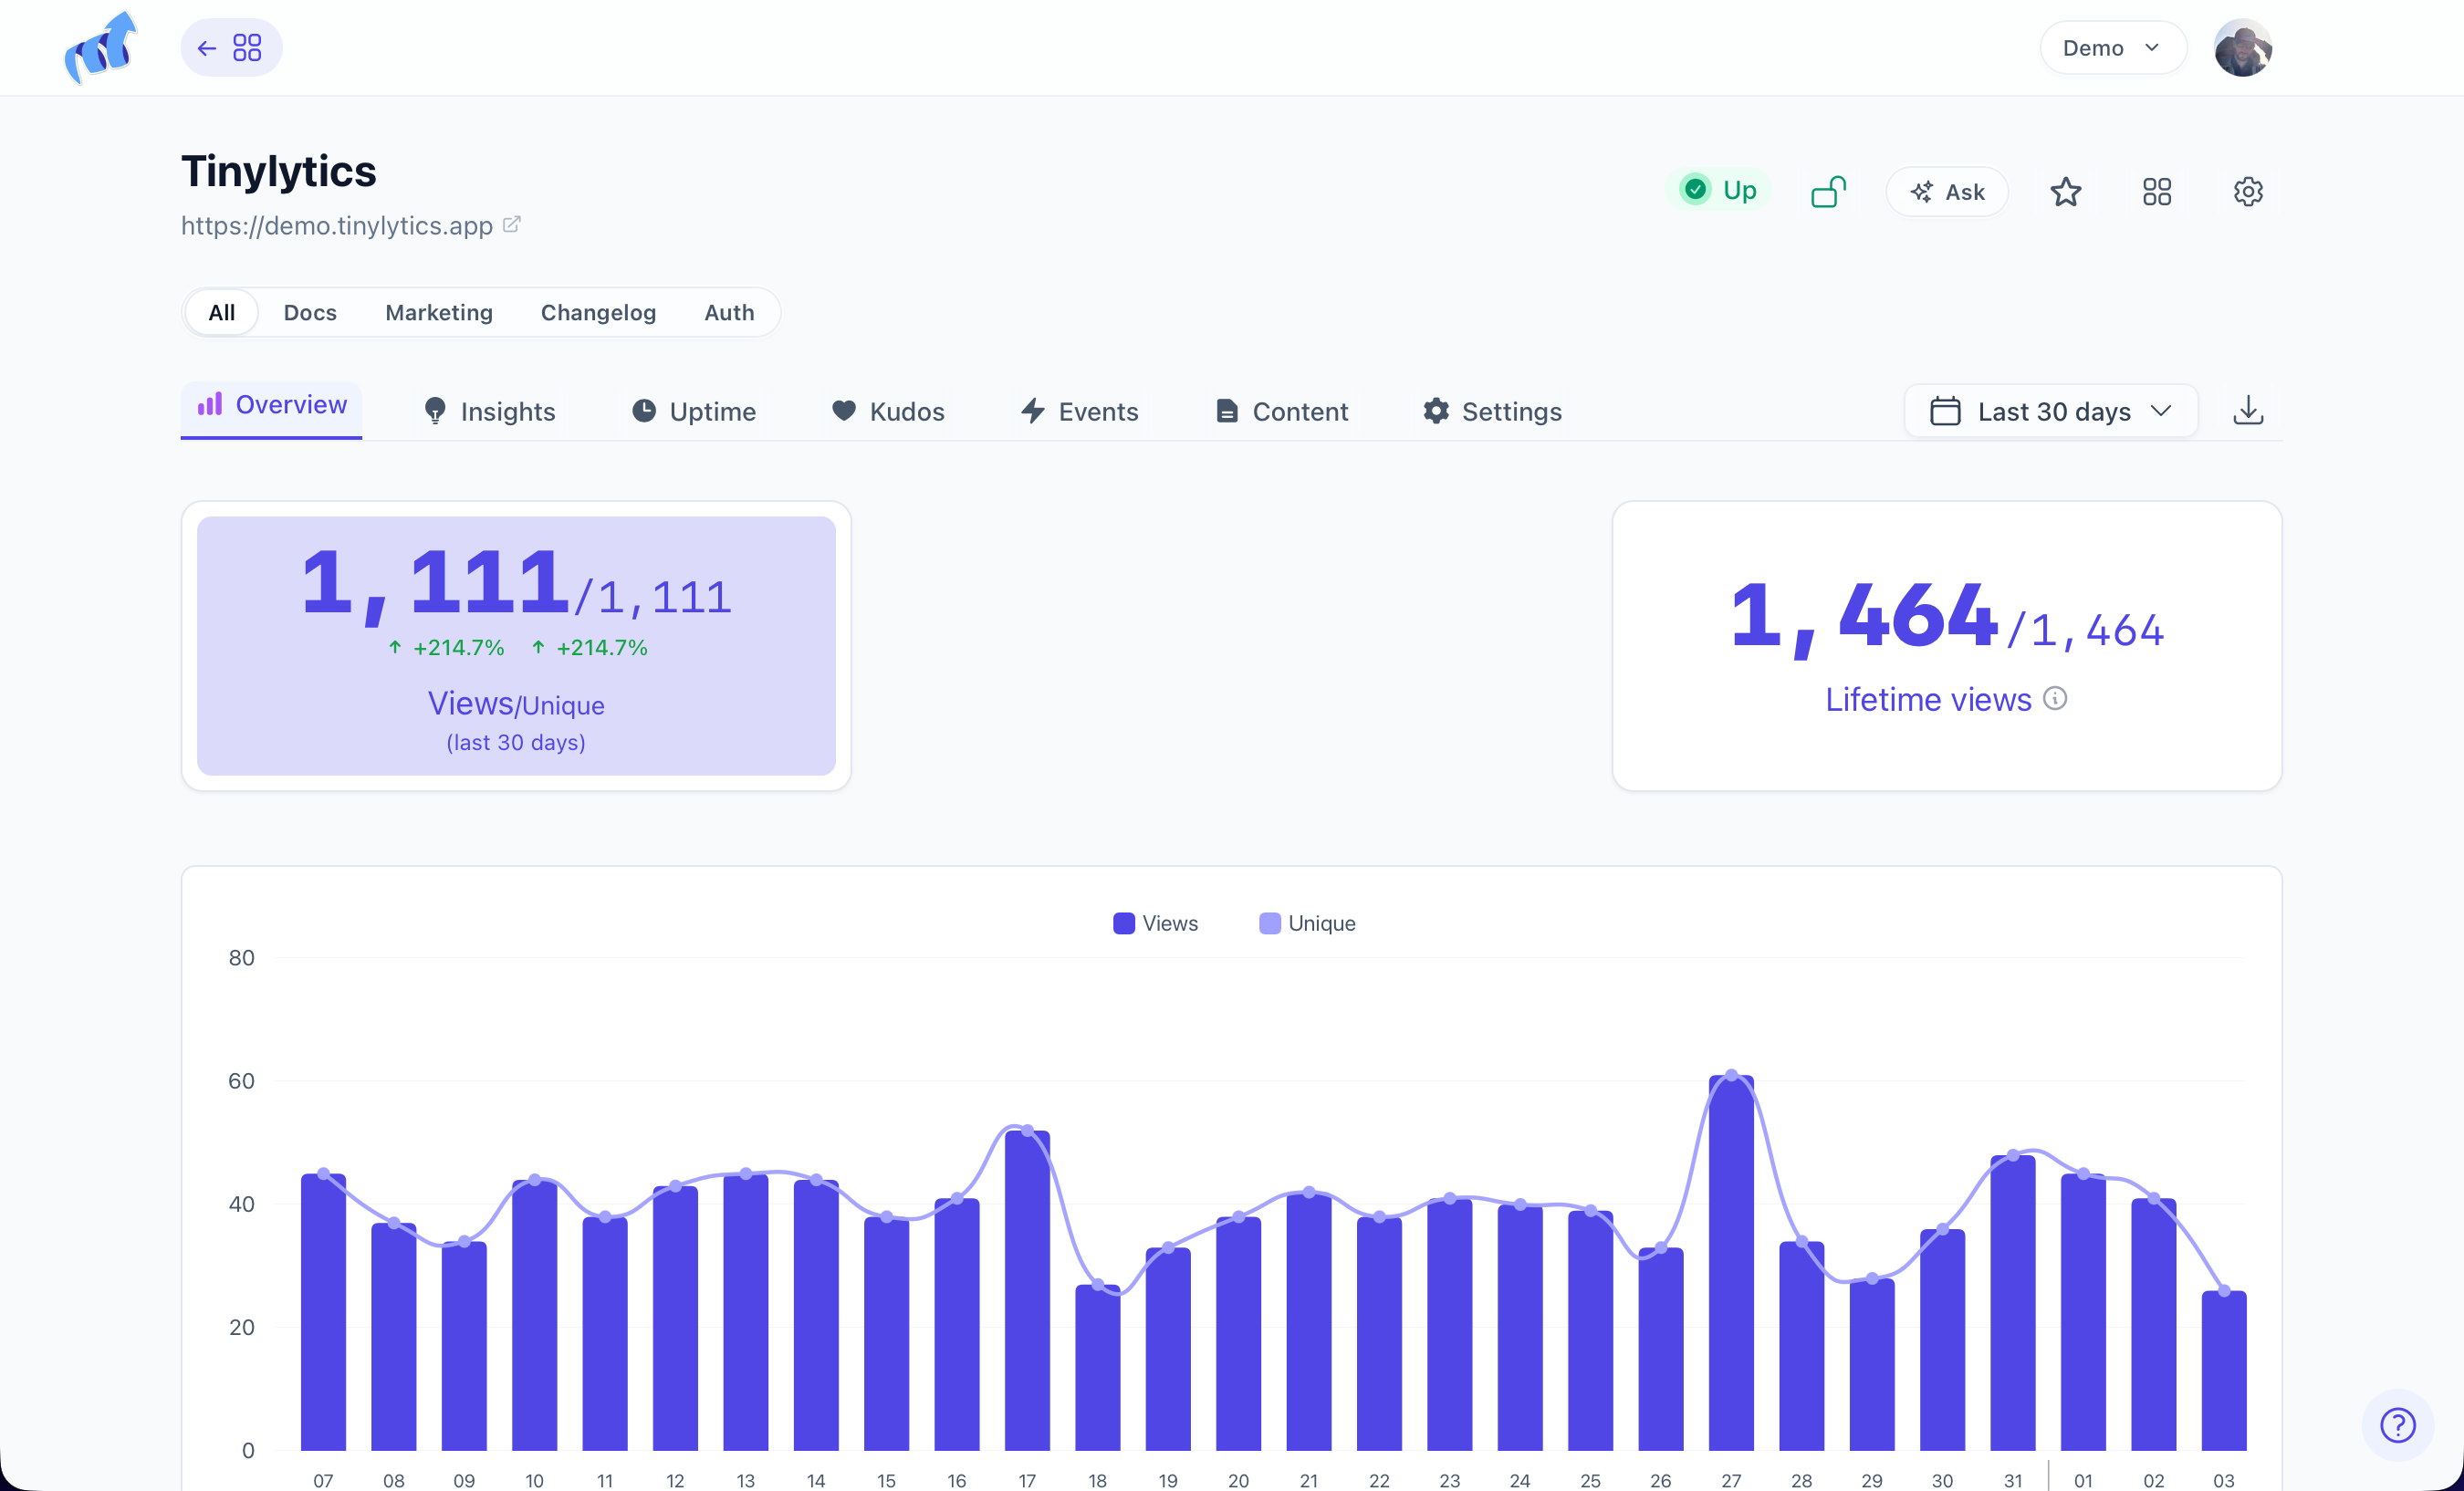
Overview on the public demo. Hits, the chart, and Paths follow the date range you pick.
Overview
Hits, unique hits (if you turned them on), the chart, and the tables under it all follow the date range, except Top pages (all time). How to read that screen is in Reading Overview.
A grid of optional cards (lifetime hits, current traffic, uptime, and the rest) sits above the chart. Turn those on or off under Settings → Appearance.
Feature tabs
Tabs appear when you enable the feature: Insights, Uptime, Kudos, Community, Content, Events. Drag the order in Settings → Appearance → Dashboard Tabs.
Settings
Settings is the hub:
- General — name, domain, timezone, allow-from-any-domain
- Appearance — colours, chart type, which stats sections show
- the embed snippet
- Public & Webring
- Collaborators (Ultra)
- Email Reports and Traffic Spikes (Ultra)
- Data Hub — segments, goals, spam, import, export
- Ignore Rules
Account
Account in the top nav is email, password, billing, team access, export, and delete. It is not inside a site.