
Your traffic, interpreted for you.
Opt in and Tinylytics surfaces what matters in your traffic—spikes, shifts, top pages, and patterns worth acting on. Insights run on meaningful signals, not vanity metrics, so you get recommendations you can actually use. Add custom instructions to steer the analysis toward what you care about.
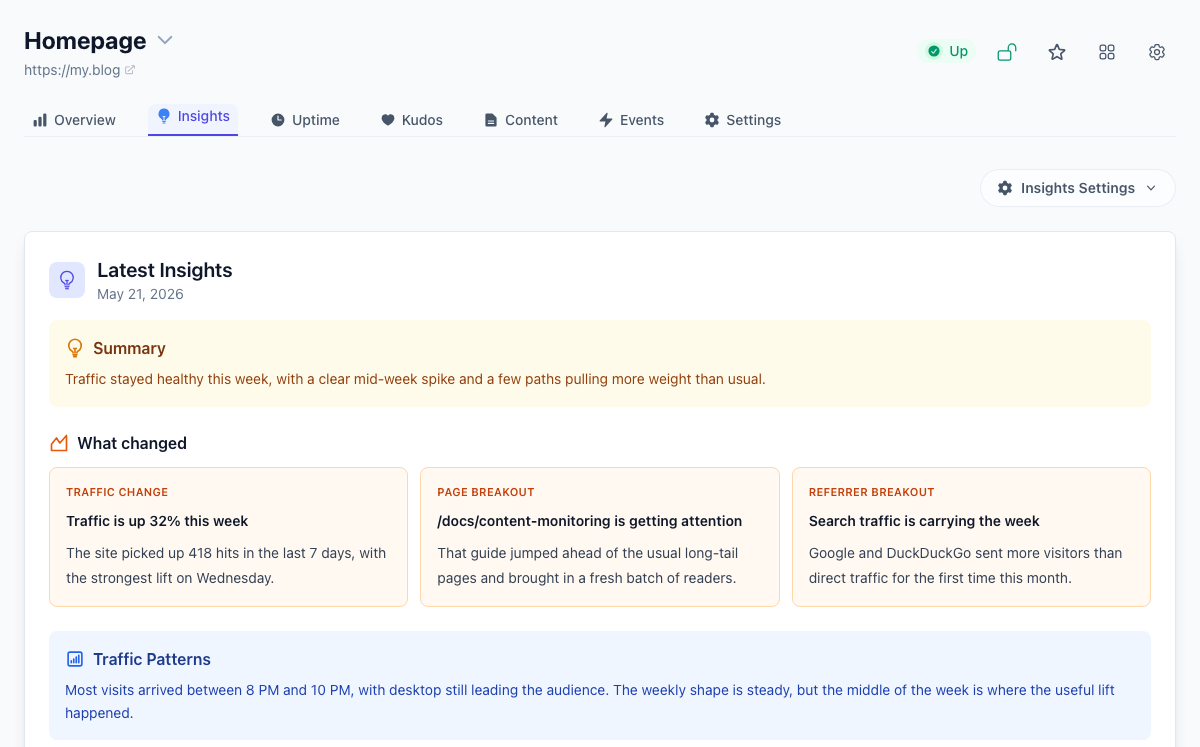
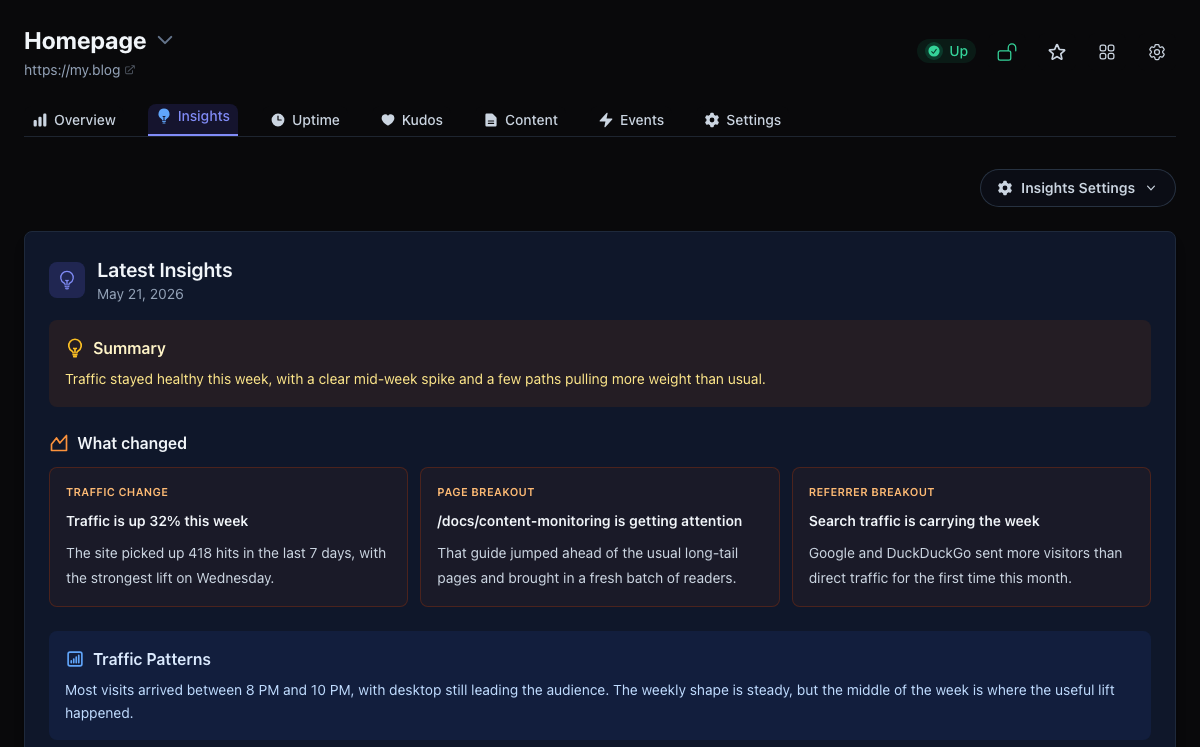
What a report looks at
Each report compares a site's last seven days with the seven before: total and unique hits, the busiest days and hours, top pages, referrers, countries, devices, browsers, and platforms. Tinylytics also picks out up to three signals worth a mention, such as traffic jumping, a page or referrer taking off, or a shift in devices or countries. On Ultra, that includes new high-severity issues from your SEO audit.
An AI model turns those counts into a short read: a summary of the week's main story, a paragraph on traffic patterns, one on your best content, and two or three recommendations. It works from totals, not from individual visits, and the last three summaries come along so it can spot a trend that keeps going.
Steering it
Custom instructions tell the report what you care about, in plain words and up to 5,000 characters. Presets for a personal blog, business website, SaaS product, portfolio, or community project give you a starting point. Tinylytics also reads a few of your public pages to work out what kind of site you run, and if you post signals through the API, such as a launch or a newsletter going out, the report can use them to explain a change.
When it runs
Turn it on from a site's Insights tab. It needs an active plan or trial and at least ten hits in the last seven days, because a smaller week has no trend to talk about. The first report is written straight away, and after that a new one arrives each day around 1:00 AM in your timezone. Your ten most recent reports stay on the tab.
Want them by email? Get one email per site, a single digest of all your sites at 9:00 AM, or both. Each new report can also go out as a webhook.